At the OpenStack Operators meetup the question was asked about monitoring issues that are related to RabbitMQ. Lots of OpenStack components use a message broker and the most commonly used one among operators is RabbitMQ. For this post I’m going to concentrate on Nova and a couple of scenarios I’ve seen in production.
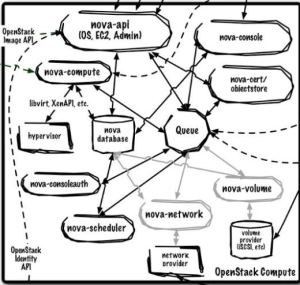
It’s important to understand the flow of messages amongst the various components and break things down into a couple of categories:
- Services which publish messages to queues (arrow pointing toward the queue in the diagram)
- Services which consume messages from queues (arrow pointing out from the queue in the diagram)
It’s also good to understand what actually happens when a message is consumed. In most cases, the consumer of the queue is writing to a database.
An example would be for an instance reboot, the nova-api publishes a message to a compute node’s queue. The compute service running polls for messages, receives the reboot, sends the reboot to the virtualization layer, and updates the instance’s state to rebooting.
There are a couple of scenarios queue related issues manifest:
- Everything’s broken - easy enough, rebuild or repair the RabbitMQ server. This post does not focus on this scenario because there is a considerable amount of material around hardening RabbitMQ in the OpenStack documentation.
- Everything is slow and getting slower - this often points to a queue being published to at a greater rate than it can be consumed. This scenario is more nuanced, and requires an operator to know a couple of things: what queues are shared among many services and what are publish/consume rates during normal operations.
- Some things are slow/not happening - some instance reboot requests go through, some do not. Generally speaking these operations are ’last mile’ operations that involve a change on the instance itself. This scenario is generally restricted to a single compute node, or possibly a cabinet of compute nodes.
Baselines are very valuble to have in scenarios 2 and 3 to compare normal operations to in terms of RabbitMQ queue size/consumption rate. Without a baseline, it’s difficult to know if the behavior is out of normal operating conditions.
There are a couple of tools that can help you out:
- Diamond RabbitMQ collector ( code, docs)- Send useful metrics from RabbitMQ to graphite, requires the RabbitMQ management plugin
- RabbitMQ HTTP API - This enables operators to retrieve specific queue statistics instead of a view into an entire RabbitMQ server.
- Nagios Rabbit Compute Queues - This is a script used with Nagios to check specified compute queues which helps determine if operations to a specific compute may get stuck. This helps what I referred to earlier as scenario 3. Usually a bounce of the nova-compute service helps these. The script looks for a local config file which would allow access to the RabbitMQ management plugin. Example config file is in the gist.
- For very real time/granular insight, run the following command on the RabbitMQ server:
- watch -n 0.5 ‘rabbitmqctl -p nova list_queues | sort -rnk2 |head’
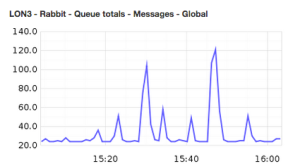
Here is an example chart that can be produced with the RabbitMQ diamond collector which can be integrated into an operations dashboard:
 Baseline monitoring of the RabbitMQ servers themselves isn’t enough. I recommend an approach that combines the following:
- Using the RabbitMQ management plugin (required)
- Nagios checks on specific queues (optional)
- Diamond RabbitMQ collector to send data to Graphite
- Dashboard combining RabbitMQ installations statistics
